

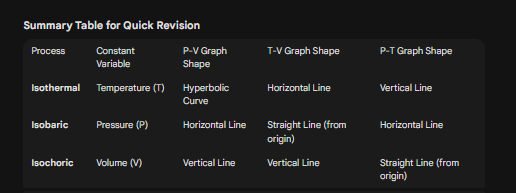
Thermodynamics: Understanding P-V, T-V, and P-T Graphs for Different Processes
Mastering Graph Conversions: How to Transform P-V to P-T and V-T Diagrams

Thermodynamics: Understanding P-V, T-V, and P-T Graphs for Different Processes
In thermodynamics, understanding how to graphically represent different processes is crucial for solving problems in entrance examinations like JEE and NEET. Today, we will break down the graphical representations (P-V, T-V, and P-T graphs) for the three primary thermodynamic processes: Isothermal, Isobaric, and Isochoric.
1. The Basics: Equation of State
Before drawing graphs, we must understand the Equation of State. The state of any gas is defined by three variables: Pressure (P), Volume (V), and Temperature (T).
For an Ideal Gas, the simplest equation of state is:
PV = nRT
Where:
P = Pressure
V = Volume
n = Number of moles
R = Universal Gas Constant
T = Temperature
We will use this equation to derive the relationships for our graphs.
2. Isothermal Process (Constant Temperature)
In an isothermal process, the temperature (T) remains constant throughout the process.
Equation: Since T is constant, the Ideal Gas equation becomes:
PV = Constant or P ∝ 1/V (Pressure is inversely proportional to Volume)
Graphical Representations:
A. P-V Graph (Pressure vs. Volume): Since P is inversely proportional to V, the graph is a curve (rectangular hyperbola).
Expansion: As Volume increases (moves right), Pressure decreases (moves down).
Compression: As Volume decreases, Pressure increases.
Shape: A smooth curve sloping downwards.
B. T-V Graph (Temperature vs. Volume): Since T is constant, the temperature value does not change even if the volume increases or decreases.
Shape: A horizontal line parallel to the Volume axis (x-axis).
C. P-T Graph (Pressure vs. Temperature): Here, T is constant on the x-axis, but Pressure changes.
Shape: A vertical line parallel to the Pressure axis (y-axis), situated at the fixed temperature value.
3. Isobaric Process (Constant Pressure)
In an isobaric process, the pressure (P) of the system remains constant.
Equation: Using PV = nRT with constant P:
V ∝ T or V/T = Constant (Charles’s Law) This means Volume is directly proportional to Temperature.
Graphical Representations:
A. P-V Graph (Pressure vs. Volume): Since Pressure is constant, its value on the y-axis does not change while Volume increases or decreases.
Shape: A straight horizontal line parallel to the Volume axis.
B. T-V Graph (Temperature vs. Volume): Since V ∝ T, the relationship is linear. As temperature increases, volume increases proportionally.
Shape: A straight line passing through the origin (sloped upwards).
C. P-T Graph (Pressure vs. Temperature): Since Pressure is constant, it does not change even if the temperature changes.
Shape: A straight horizontal line parallel to the Temperature axis.
4. Isochoric Process (Constant Volume)
In an isochoric process, the volume (V) of the gas remains constant. No work is done in this process (W = 0).
Equation: Using PV = nRT with constant V:
P ∝ T or P/T = Constant (Gay-Lussac’s Law) This means Pressure is directly proportional to Temperature.
Graphical Representations:
A. P-V Graph (Pressure vs. Volume): Since Volume is fixed on the x-axis, it cannot move left or right. Only pressure changes.
Shape: A vertical straight line parallel to the Pressure axis.
B. T-V Graph (Temperature vs. Volume): Similar to the P-V graph, the volume is fixed.
Shape: A vertical straight line parallel to the Temperature axis.
C. P-T Graph (Pressure vs. Temperature): Since P ∝ T, the graph shows a linear relationship.
Shape: A straight line passing through the origin (sloped upwards).
5. A Note on Adiabatic Process
While we focus mainly on the first three, it is vital to distinguish the Adiabatic Process (where no heat is exchanged, Q=0) from the Isothermal process on a P-V graph.
Equation:
PVᵞ = Constant (where γ > 1)
Key Difference in P-V Graph: Both Isothermal and Adiabatic graphs show curves where Pressure drops as Volume increases. However, due to the factor gamma (γ), the Adiabatic curve is steeper than the Isothermal curve.
Here is the revised article using standard text and Unicode symbols, with the image placeholder removed.
Understanding the Adiabatic Process: A Quick Revision
In thermodynamics, one of the most crucial concepts for students preparing for exams like JEE Mains and NEET is the adiabatic process. This article breaks down the definition, key equations, and specific characteristics of this process as explained in the lecture.
What is an Adiabatic Process?
An adiabatic process is defined as a thermodynamic process in which there is no exchange of heat with the surrounding environment.
Mathematically, this means the heat supplied or taken from the system is zero (ΔQ = 0).
First Law of Thermodynamics for Adiabatic Process
Since ΔQ = 0, the First Law of Thermodynamics is modified for this specific process. The relationship between internal energy and work done is written as:
ΔU = -ΔW
This implies that the change in internal energy (ΔU) is equal to the negative of the work done by the system.
Key Equations of the Adiabatic Process
Unlike isothermal processes where temperature is constant, all three variables—Pressure (P), Volume (V), and Temperature (T)—change during an adiabatic process. These changes follow specific mathematical relations involving γ (gamma):
Pressure-Volume Relation: PVᵞ = constant
Temperature-Volume Relation: TV⁽ᵞ⁻¹⁾ = constant
Temperature-Pressure Relation: TᵞP⁽¹⁻ᵞ⁾ = constant
Understanding Gamma (γ): The Adiabatic Index
The symbol γ is known as the Adiabatic Index. It is defined as the ratio of specific heat at constant pressure (Cp) to specific heat at constant volume (Cv).
γ = Cp / Cv
The value of γ depends entirely on the atomicity of the gas:
Monoatomic Gas: γ = 1.67
Diatomic Gas: γ = 1.4
Triatomic Gas: γ = 1.33
Work Done in an Adiabatic Process
Calculating the work done is essential for solving numerical problems. The formula for work done (W) in an adiabatic process is:
W = (P₁V₁ - P₂V₂) / (γ - 1)
Alternatively, using the Ideal Gas Law (PV = nRT), the work done can also be expressed in terms of temperature change:
W = nR(T₁ - T₂) / (γ - 1)
Application Example: Linking Adiabatic Process with RMS Velocity
In advanced problems, you may need to link the adiabatic process with concepts like Root Mean Square (RMS) velocity.
Concept: Since RMS velocity depends on temperature (Vrms ∝ √T), if you need to change the velocity, you must change the temperature.
Process: You can determine the new temperature required to achieve a specific velocity (e.g., halving the velocity requires reducing the temperature to 1/4th).
Connection: Once the new temperature (T₂) is found, you can use the adiabatic equation T₁V₁⁽ᵞ⁻¹⁾ = T₂V₂⁽ᵞ⁻¹⁾ to find the required change in volume.
For instance, to reduce the RMS velocity to half in a gas with γ = 1.5, the gas must be expanded to 16 times its original volume (V₂ = 16V₁).
Slope of Adiabatic Process > Slope of Isothermal Process.
Mastering these graphs is essential for interpreting thermodynamic cycles and solving graphical questions in physics entrance exams. Stay tuned for the next article where we will dive deep into the complexities of the Adiabatic Process!
Here are 10 Multiple Choice Questions based on the provided video summary.
1. Which equation is introduced as the foundational equation of state for ideal gases?
A) PV^γ = constant
B) V/T = constant
C) PV = nRT
D) P ∝ T Answer: C
2. In an isothermal process, which variable remains constant?
A) Pressure
B) Volume
C) Temperature
D) Heat Answer: C
3. What is the shape of the PV graph for an isothermal expansion process?
A) A straight horizontal line
B) A straight vertical line
C) A hyperbola
D) A straight line passing through the origin Answer: C
4. For an isobaric process, which relationship between Temperature (T) and Volume (V) is correct?
A) T ∝ 1/V
B) T ∝ V
C) T = constant
D) V = constant Answer: B
5. How is an isobaric process represented on a PV graph?
A) As a horizontal line
B) As a vertical line
C) As a curve with a steep slope
D) As a curve with a gentle slope Answer: A
6. Which mathematical relation represents an adiabatic process?
A) PV = constant
B) P/T = constant
C) V/T = constant
D) PV^γ = constant Answer: D
7. How does the slope of the PV graph for an adiabatic process compare to that of an isothermal process?
A) The adiabatic slope is less steep
B) The adiabatic slope is steeper
C) The slopes are identical
D) The adiabatic slope is horizontal
Answer: B
8. Which process is represented by a vertical line on a PV graph (indicating constant volume)?
A) Isobaric
B) Isothermal
C) Isochoric
D) Adiabatic
Answer: C
9. In a T-V graph for an isothermal process, how does the temperature behave as volume changes?
A) It increases linearly
B) It decreases exponentially
C) It remains constant
D) It increases proportionally to pressure
Answer: C
10. Why is the adiabatic process described as more complex than the others in the video?
A) Because pressure remains constant
B) Because it involves the adiabatic index (γ) and temperature varies
C) Because it follows the ideal gas law exactly like an isothermal process
D) Because it is represented by a straight line on a PV graph
Answer: B
Q1. According to the First Law of Thermodynamics for an adiabatic process, which of the following relations is correct? A) ΔQ = ΔW B) ΔU = -ΔW C) ΔU = ΔW D) ΔW = 0
Q2. Which equation correctly represents the relationship between Temperature (T) and Volume (V) for an adiabatic process? A) TVᵞ = constant B) TV⁽ᵞ⁻¹⁾ = constant C) TᵞV = constant D) TV = constant
Q3. What is the value of the adiabatic index (γ) for a diatomic gas as mentioned in the lecture? A) 1.67 B) 1.33 C) 1.4 D) 1.5
Q4. Which formula represents the work done (W) in an adiabatic process? A) PΔV B) nRT ln(V₂/V₁) C) (P₁V₁ - P₂V₂) / (γ - 1) D) nR(T₂ - T₁) / γ
Q5. In the solved example, to reduce the RMS velocity of a gas to half its original value, what must happen to the temperature? A) It must remain constant. B) It must be reduced to 1/2 of the initial temperature. C) It must be reduced to 1/4 of the initial temperature. D) It must be doubled.
Answer Key
B) ΔU = -ΔW (Since ΔQ = 0, ΔU + ΔW = 0 → ΔU = -ΔW)
B) TV⁽ᵞ⁻¹⁾ = constant (Standard adiabatic relation)
C) 1.4 (Gamma for diatomic gas is 1.4)
C) (P₁V₁ - P₂V₂) / (γ - 1) (Work done formula)
C) It must be reduced to 1/4 of the initial temperature. (Since Vrms ∝ √T, to halve velocity, T must become T/4)
🔬 Physics Challenge: Analyzing Cyclic Processes
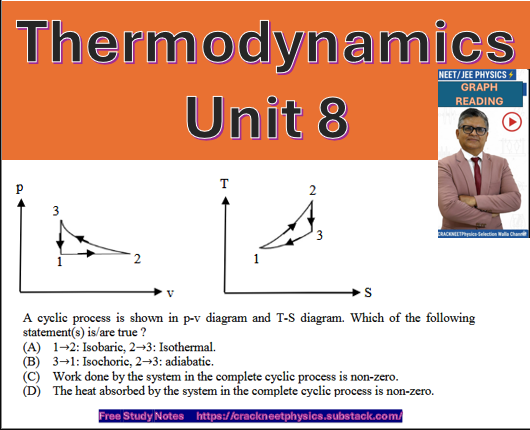
Question: A cyclic process is shown in a p-V diagram and a T-S diagram. Which of the following statement(s) is/are true?
(A) 1→2: Isobaric, 2→3: Isothermal. (B) 3→1: Isochoric, 2→3: Adiabatic. (C) Work done by the system in the complete cyclic process is non-zero. (D) The heat absorbed by the system in the complete cyclic process is non-zero.
💡 Step-by-Step Student Guide (Unicode)
To solve this, we must map the processes between the Pressure-Volume (p-V) graph and the Temperature-Entropy (T-S) graph.
📍 Step 1: Analyze Process 1→2
p-V Graph: The line is horizontal. This means Pressure (p) is constant.
T-S Graph: Both Temperature (T) and Entropy (S) are increasing.
Conclusion: This is an Isobaric Expansion. Statement (A) is partially correct.
📍 Step 2: Analyze Process 2→3
p-V Graph: A curved drop in pressure and volume.
T-S Graph: The line is vertical. This means Entropy (S) is constant (ΔS = 0).
Conclusion: A process with constant entropy is an Adiabatic process. Statement (B) is partially correct.
📍 Step 3: Analyze Process 3→1
p-V Graph: The line is vertical. This means Volume (V) is constant.
T-S Graph: Temperature and Entropy are both decreasing.
Conclusion: This is an Isochoric process. Statement (B) is now fully confirmed.
📍 Step 4: Analyze the Net Cycle (Work & Heat)
Work Done (W): In a p-V diagram, the area enclosed by the cycle represents the net work done. Since the cycle has a non-zero area, Wnet=0.
Internal Energy (U): For any complete cycle, the change in internal energy is zero (ΔU = 0).
First Law of Thermodynamics: Q=ΔU+W. Since ΔU=0 and W=0, then Q (Net Heat) must also be non-zero.
✅ The Final Verdict
Based on our analysis, the true statements are:
(B) is true (3→1 is Isochoric, 2→3 is Adiabatic).
(C) is true (Net Work is the area of the cycle, which is non-zero).
(D) is true (Net Heat must equal Net Work in a cycle).
Note: Statement (A) is false because 2→3 is Adiabatic, not Isothermal.